SERVICE LEADERSHIP, INC.®, A CONNECTWISE COMPANY
Discover the data-driven path to best-in-class profitability
Unlock your full growth potential with real-world benchmarking and time-tested performance frameworks
Benchmarking
Take a quarterly look at your financial performance with the Service Leadership Index® - the gold standard for IT solution provider benchmarking worldwide.
Performance improvement
SLIQ™ is an online tool for IT solution provider management teams, offering a tailored Action Plan and best practices to drive higher performance.
Annual industry reports
Get insights, analysis, and trends from two annual reports that are not available anywhere else in the IT solution provider industry.
Peer groups
Achieve your goals faster through best practice expertise, actionable peer insight, and accountability in confidential owner and C-level peer groups.
benefits
Why IT solution providers choose Service Leadership as their guide to growth and profitability
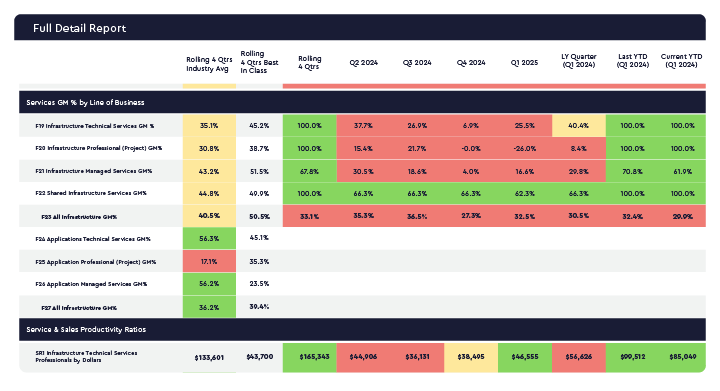
Data-driven insights
Benchmark with confidence
Get clear answers to “How are you really doing?” using actual data from the Service Leadership Index. With quarterly benchmarks across 80+ metrics, you’ll gain an unmatched view of your financial and operational performance and how you stack up to the best-in-class in your business model—so you know exactly where you stand.
Customize action plan
Take the guesswork out of how to improve
Get a detailed, prioritized action plan specifically designed for your company. Whether you need to improve cash flow, service delivery, or security posture, SLIQ™ guides you every step of the way to achieve greater operational maturity and profitability.
IT Solution Provider Industry Insights and Analysis
See how the industry is doing in your business model
Discover how top performers in your business model, such as MSPs and VARs, are evolving, profiting, and compensating their employees with data insights exclusively available in the Service Leadership Index Annual IT Solution Provider Industry Profitability and Compensation Reports.
Best Practices and Accountability
Join a Service Leadership peer group to attain your financial goals
Join a group of owners and C-level executives from non-competing geographies to openly exchange information, share insights, and advice to reach a higher level of financial performance.
Service Leadership benchmarking solutions
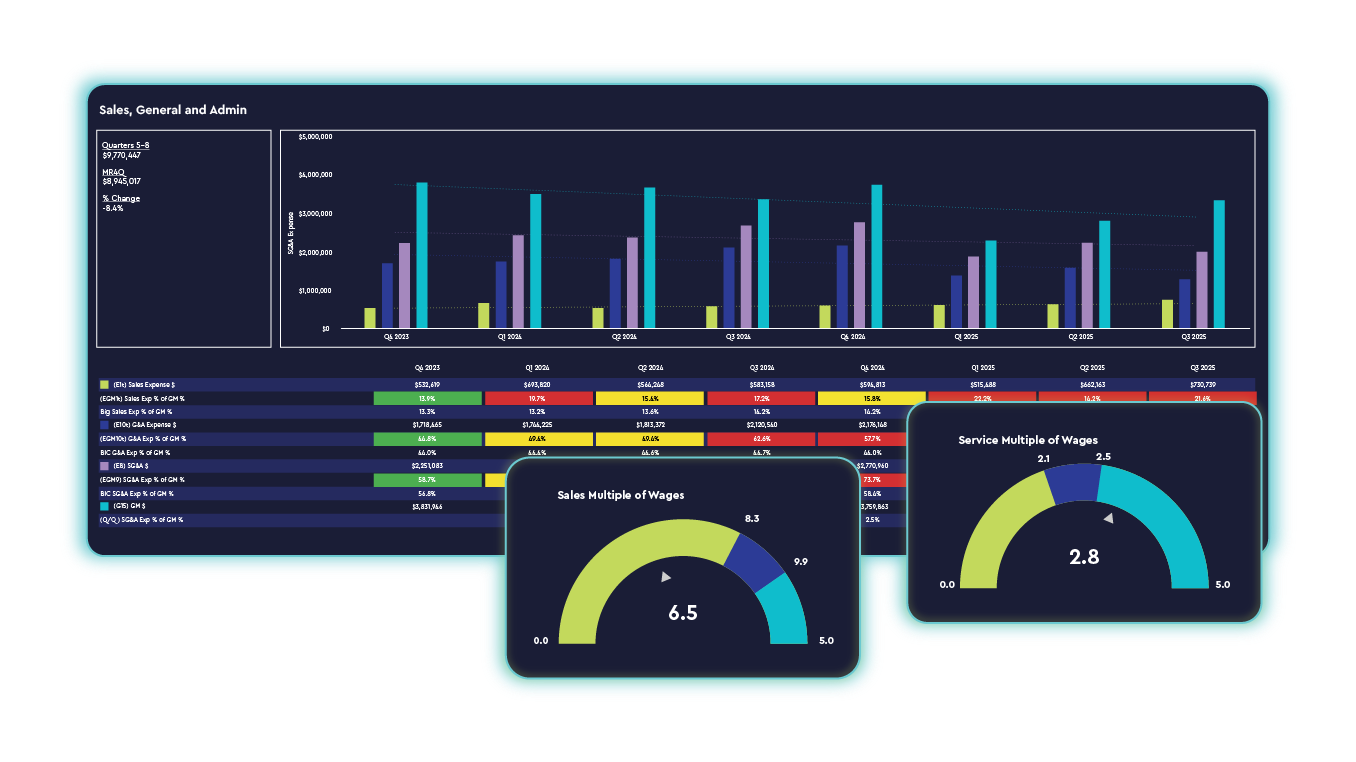
Instantly benchmark your financial performance against best-in-class
With Service Leadership Index® benchmarking solutions, you can quickly view and understand your company’s financial performance each quarter, whether you’re just getting started or ready for deeper analysis.
Our benchmarking tools provide insights tailored to your business stage:
- Benchmark Essentials is a simplified experience designed for IT solution providers with annual revenue below $1.5M, including fewer data inputs and clear, actionable financial insights.
- Service Leadership Index® is a comprehensive benchmarking platform with access to 80+ metrics for in-depth analysis and strategic decision-making.
Both solutions share a common interface, making it easy to seamlessly upgrade as your needs evolve. Compare your performance quarter-over-quarter and see how you stack up against best-in-class companies in your business model.
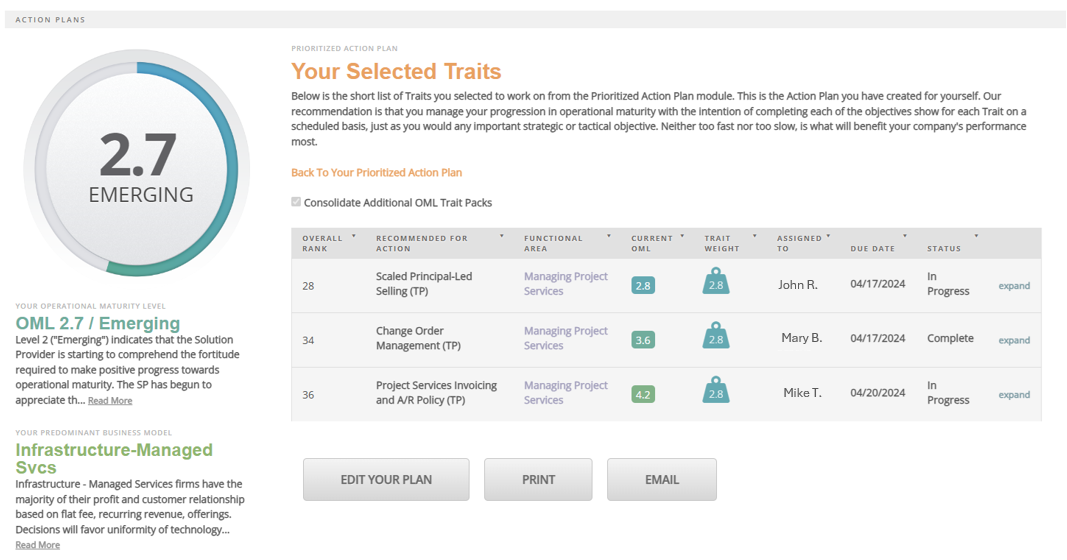
SLIQ
Accelerate Performance and Maximize Your Company’s Profitability
SLIQ uses your company’s specific inputs to determine your firm’s Operational Maturity Level™, then creates a customized Action Plan to help you achieve greater operational maturity and profitability. It assesses your current operational methods and provides tools, videos and white papers to help improve your performance.

Service Leadership Peer Groups
Best practices, benchmarking, and accountability
Join a group of C-level executives from non-competing geographies who support each other in reaching the next level of business performance and are willing to share insights to help improve your business.
SERVICE LEADERSHIP CERTIFICATION
Become a Service Leadership certified coach, consultant, or peer group facilitator
SERVICE LEADERSHIP INDEX BENCHMARKING
This three-week course includes a video lecture and test.
You will be able to analyze a company’s financial performance, and provide your clients or members with an objective and data-based perspective of their business.
SLIQ OPERATIONAL MATURITY LEVEL ACCELERATION CONSULTING
This four-week program includes a video lecture and test.
At the end of the program, you will be able to assess a client or member’s management methods, and provide recommendations on what to focus on first to help grow their business.
Additional Service Leadership Resources
Service Leadership Profitability Bundle
Provides a systematic approach to put you on the path to driving greater revenue, reducing costs, and incurring less risk.
Normalized Solution Provider Chart of Accounts
Valuable information on how to "normalize" or structure your chart of accounts for maximum financial visibility and control.
The What and Why of Operational Maturity Levels
Explains how operational maturity relates to profit and building shareholder value.
Enabling Accurate Benchmark Comparisons
Identifying your Predominant Business Model enables direct comparisons of key drivers, aiding in evaluating management techniques and decisions that safely produce the best results.